Are you Prepared for Tax Increases?

How will the government bounce back from the COVID-19 debt? Taxes!
Wondering how the country will bounce back from the debt incurred during COVID-19? Reducing this debt will likely come with challenges, which includes a greater burden on taxpayers. As the economy begins to return to normal, federal and state governments will look to create new, innovative ways to gain capital. Learn more about post-COVID tax plans and the implications of Tax Freedom Day in the Forbes article below:
Prepare For Higher Taxes In A Post Covid-19 World
I cover the intersection of economics, politics and personal finance.
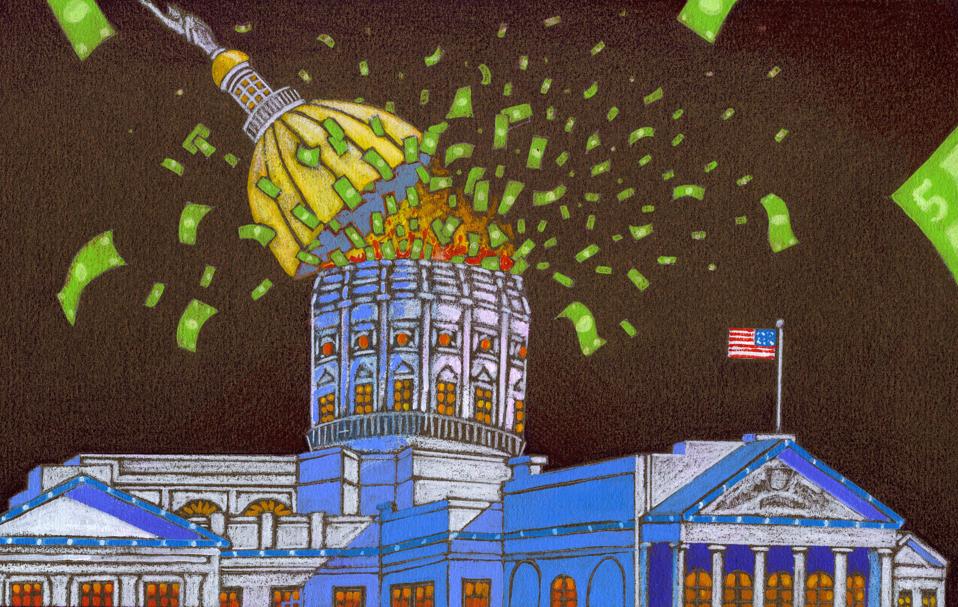
Colored pencil and acrylic illustration of Government Spending blowing the roof off a capital … [+]
Getty
The government’s response to the Covid-19 pandemic has led to a massive increase in public debt. Reducing this debt will present many challenges, including a greater tax burden on Americans, many of whom were already struggling to make ends meet. Once this crisis passes, federal and state governments will be seeking new and innovative ways to increase revenue, which of course translates to greater taxation.
In this article, you will discover how many days it took Americans to pay their share of all federal, state, and local taxes each year from 1900 to 2019 (i.e. Tax Freedom Day). You will also find the highest and lowest marginal tax brackets from the inception of the modern income tax in 1913 to the present. We’ll note how tax rates changed based on the political party that occupied the White House. Finally, we’ll look at the most likely sources of new tax revenue.
Taxation
Most realize that taxes are necessary to fund government programs. We find evidence of this in our daily lives. For example, if you smoke, you pay a cigarette tax. If you drink, you pay a tax on wine, beer, and other spirits. Drivers pay a gasoline tax and most people are subject to a sales tax. We also pay a tax on our cell phone usage, utility bills, and hundreds of other items. This begs the question: How many days does it take us each year to pay our tax burden? The answer is found in the Tax Freedom Day.
What is Tax Freedom Day?
TFD was the brainchild of businessman Dallas Hostetler. Developed in 1948, Hostetler saw this as a way to measure the percentage of the total national income required to pay the annual cost of federal, state, and local government programs. Tax Freedom Day is the first day of each year in which Americans have paid the entire tax burden for all federal, state, and local government programs for that particular year. For example, if TFD were February 28, then it could be said that it took about 59 days to pay all federal, state, and local taxes. Let’s look at the following chart, which shows the Tax Freedom Day from 1900 to 2019, the highest and lowest marginal income tax bracket since 1913, and the political party that held the presidency.
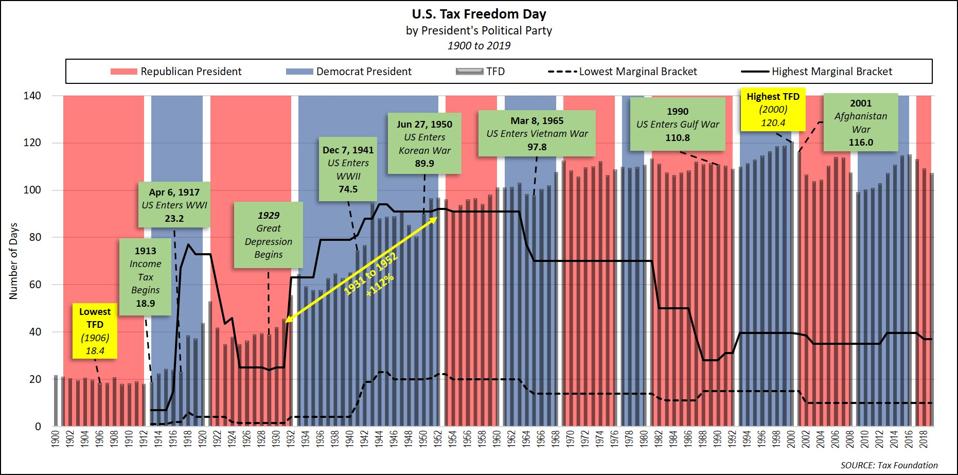
US Tax Freedom Day
MJP
Tax Freedom Day: A Quick View of the Data
The fewest number of days it took Americans to pay their annual tax burden was 18.4 days in 1906. The highest was 120.4 days in 2000. The chart shows how TFD increased 112% from 1931 to 1952. Much of this increase can be attributed to a series of initiatives put forth by Franklin Roosevelt, dubbed the New Deal that included public work projects, financial reforms, and other regulations. Moreover, marginal tax rates were raised significantly during the Great Depression. Other factors were WWII and the Korean War.
Tax Freedom Day and Marginal Tax Rates
The modern income tax began with the 16th Amendment to the constitution in 1913. The top marginal bracket began at a mere 7%. Four years later it reached 67% and by 1918 it was up to 77%. Of course, we were involved in WWI at that time. The top marginal bracket was reduced to 25% in 1925, which helped fuel the economic renaissance known as the “Roaring Twenties.” Note that, as tax rates fell, TFD tended to follow.
Tax Freedom Day by Presidential Party
Although the presidency is only one of three branches of the federal government, it does wield a great deal of power. How has TFD changed under a republican or democrat president? Under President Trump, Tax Freedom Day declined from 113 days in 2017 to 107 days in 2019. During the Obama administration, TFD rose from 99 days in 2009 to 115 days in 2016. Under President Bush (the younger), TFD was 116 days in 2001 and 107 in 2008.
When you calculate the average percentage change in TFD by political party, we find that when a Republican held the presidency, TFD declined by -3.4% but when a democrat was in the White House, TFD rose by an average of 35.7%. It should be noted that there are many factors affecting this including congressional action, war, and other events.
With the expanding government budget shortfall and surging debt, when the war on COVID-19 is over, we should expect higher taxes from the federal and state governments. According to the Tax Policy Center, the largest potential source of new revenue would be a value-added tax or national sales tax (not sure who reaps the “value”). We could see a carbon tax and even a tax on unhealthy foods and drinks. I wonder if Congress will attempt to pass a tax on retirement plans. At some point, Americans might rise and shout, “I’m mad as hell and I’m not gonna take it anymore!” We’ll see.
Stay tuned.

